App Metrics
Application analytics empowers developers with powerful data and insights. Developers can now make data-driven decisions, enhance their applications, engage users more effectively, and achieve better results in user acquisition, retention, and revenue generation. By regularly monitoring and analyzing these metrics, developers can adapt to changing market dynamics and create more successful, user-centric applications.
Glossary
At Miro, we use the following terminologies relating to application analysis:
| Terminology | Description |
|---|---|
| Installation | the application was installed for a team from the Miro Marketplace or by using a direct installation link. |
| Uninstallation | the application was removed for a Miro user or a team. |
| User activity | usage of Web SDK or REST API within the user session from the application. Important:When a hardcoded client secret is used for REST API requests, Miro Analytics considers this as only one user, even if a request was triggered by a user action from the application UI. |
| Active user | a user who does at least 1 user activity in the application. |
| Recurring user | a user of the application who has been considered an active user for more than one day over the 30 days. |
| Company account | refers to the central subscription or membership account held by a business or organization. This account encompasses all the individual user accounts of employees or users. |
User engagement metrics
Miro's Developer Hub Analytics enables developers to track user engagement metrics, such as the number of installations, daily active users, and user retention rates. These metrics help developers understand how frequently users interact with their apps and whether they are sticking around.
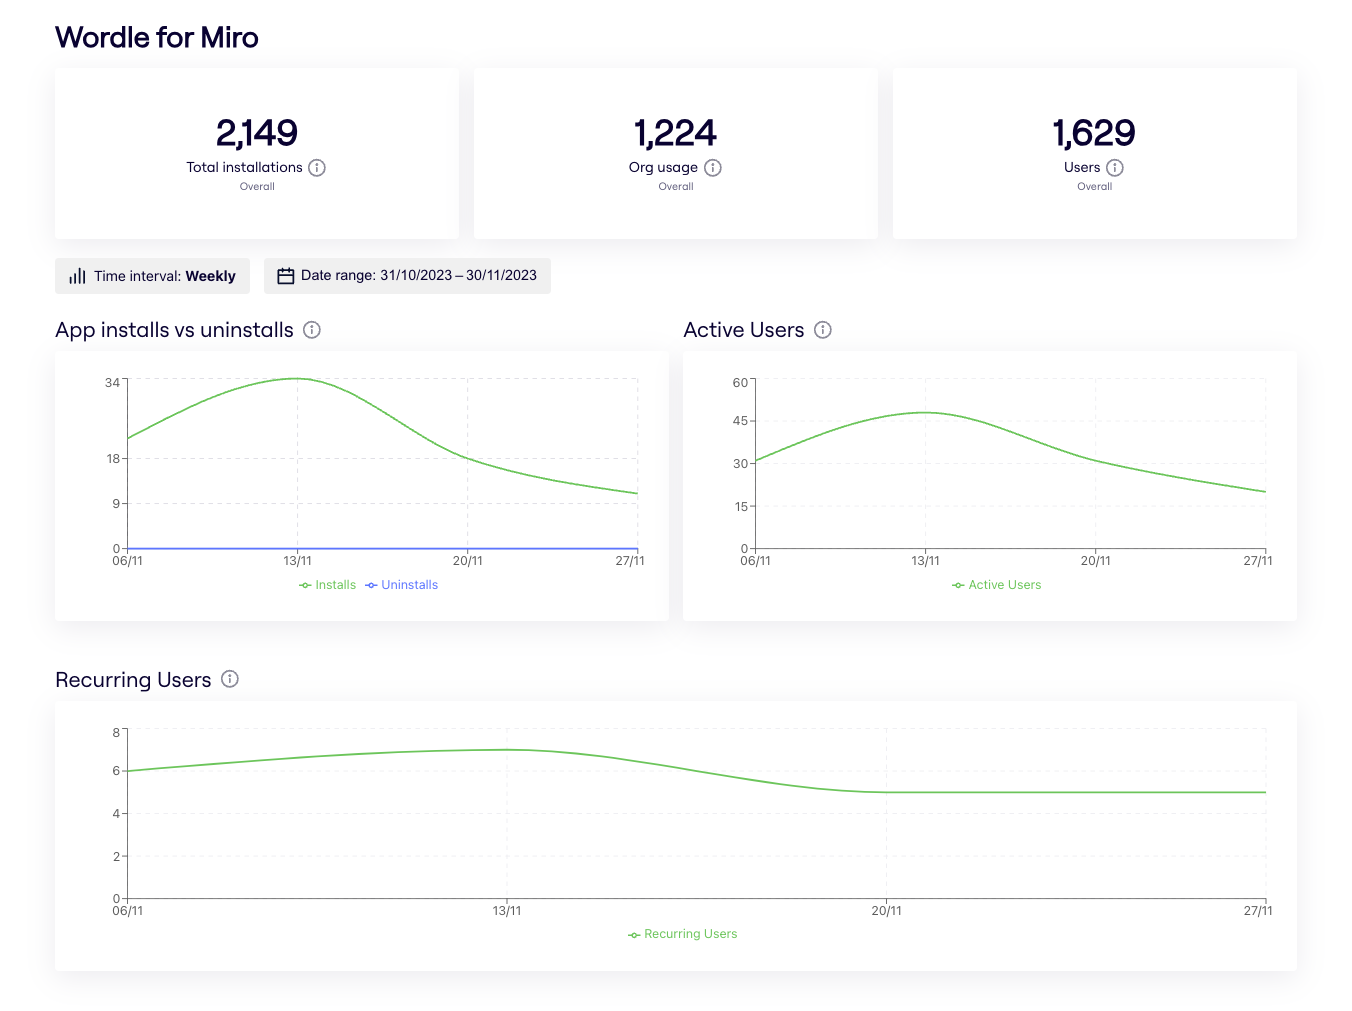
Top line metrics
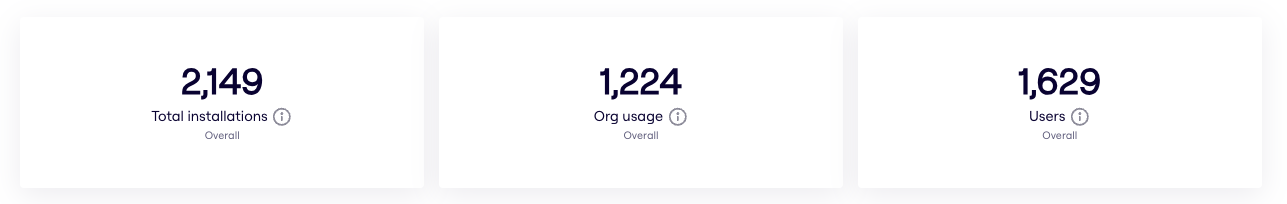
Top-line metrics, also known as key performance indicators (KPIs), are fundamental metrics that provide a snapshot of the overall success and performance of the application. These metrics include:
- Total installations: Total number of application installations for a team since it was created.
- Org usage: Total number of unique company accounts that have installed the application since it was created.
- Users: Total number of unique active users of the application, since it was created.
Over time charts
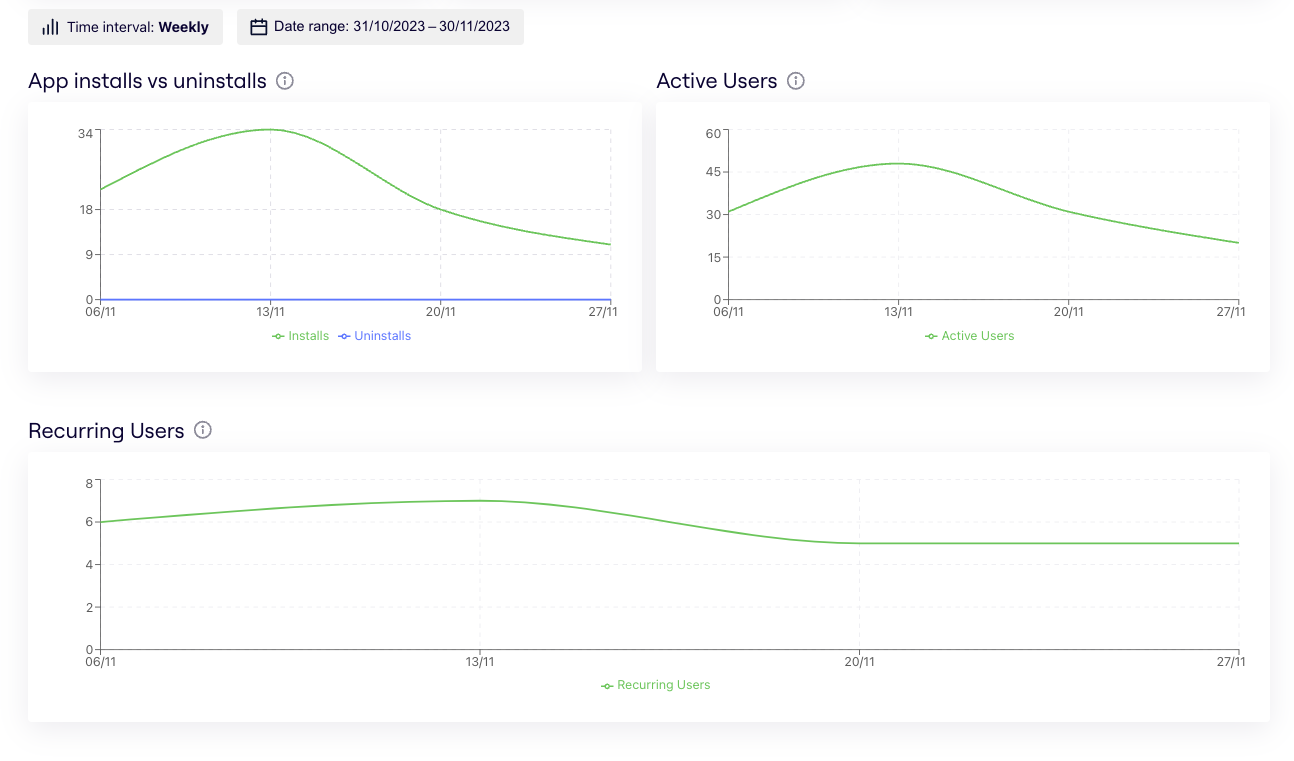
The over time chart indicates how a particular variable or set of data points changes or evolves over a specific period. These charts are valuable for tracking trends, patterns, and fluctuations in data over time, making them useful for various analytical and reporting purposes.
- App installs vs uninstalls: Chart of installations and uninstallations on a daily or weekly basis over a period of time.
- Daily active users: Chart of unique active users on a daily or weekly basis over a period of time.
- Recurring users: Chart of unique recurring users on a daily or weekly basis over a period of time.
Accessing the app metrics dashboard
The App metrics dashboard is available to all Public (listed on the Miro Marketplace) and Private V2 Platform apps built on either the Web SDK or REST API.
To access the dashboard for an applicable app navigate follow these steps:
- Navigate to the Developer Hub while signed into Miro
- Scroll down to Your apps
- Hover over to the app you wish to see metrics for:
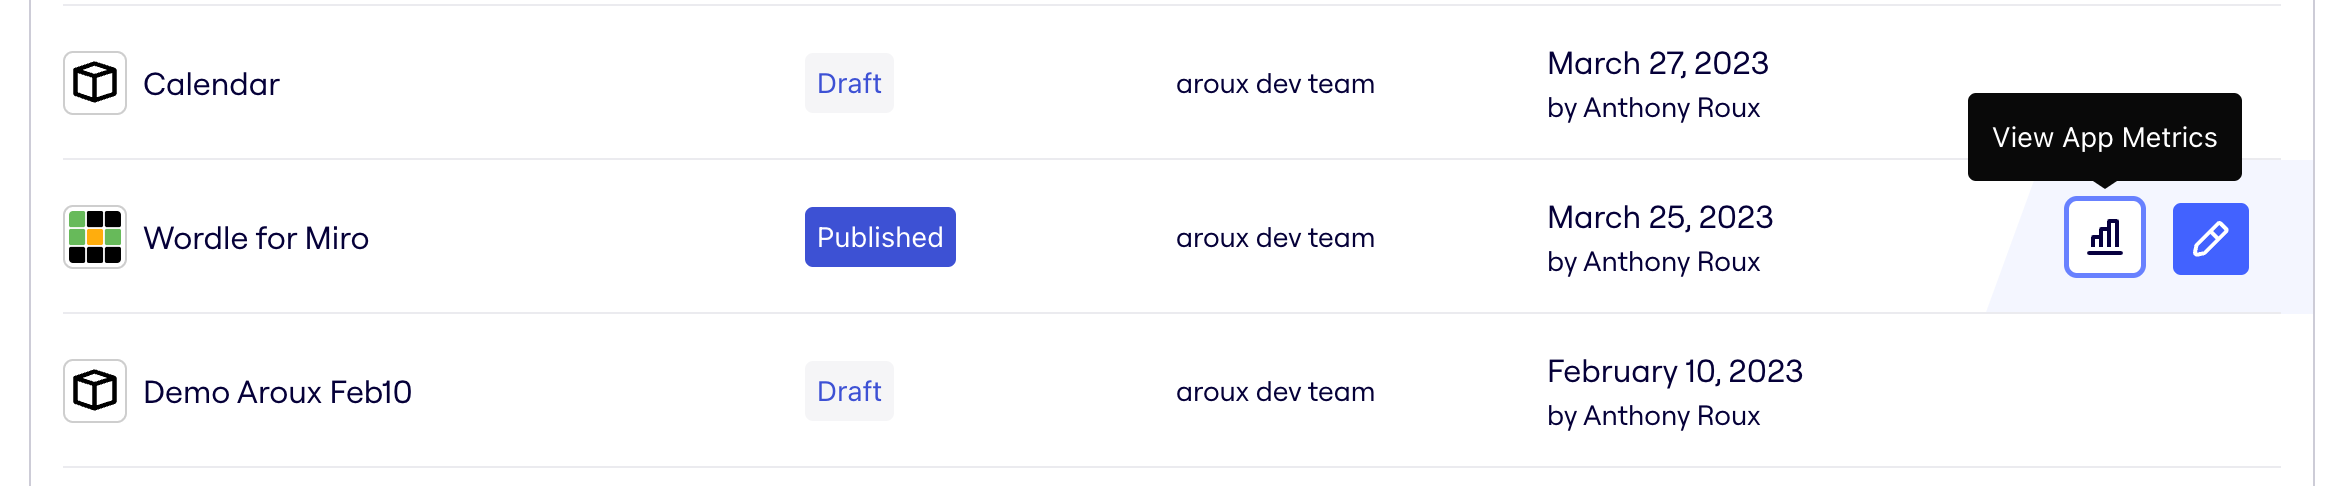
- Click the View App Metrics button
Updated 4 months ago